MCPower — Validating Sample-Size Crossing Estimates
What this report shows
The model-based crossing feature fits an isotonic (PAVA) regression of
the simulated power-vs-N curve and reports the interpolated N where the
fit crosses the target — this is n_achievable, the headline “Required
N”. The fit also provides a Wilson-band 95% CI on that crossing, rounded
outward to integers (ci_lo, ci_hi).
This report checks that the coarse default grid (~12 auto-placed points at 1 600 sims) agrees with a dense ground truth (step-2 grid at 100 000 sims):
- Accuracy gate: |coarse n_achievable − dense n_achievable| /
dense ≤
CROSSING_TOL$n_rel. - Coverage gate:
[floor(ci_lo), ceiling(ci_hi)]brackets the dense crossing.
Cases: OLS two-predictor (cross_ols), logistic two-predictor
(cross_glm), LME random-intercept (cross_lme), and OLS with a small
second effect (cross_partial) where x2=0.05 is NOT expected to reach
80% within the grid.
How the check works
- Dense run —
by = 2over[FROM_SIZE, TO_SIZE]atN_SIMS_DENSEsims. The dense empirical crossing per target isn_achievablefromfitted. - Coarse run — auto-grid (~12 points) at
N_SIMS_COARSEsims. The coarse estimate isn_achievable+[ci_lo, ci_hi]fromfitted. - Gates are computed per fitted target from the two runs.
The thresholds
| Quantity | Allowed difference | Why |
|---|---|---|
n_rel |
≤ CROSSING_TOL$n_rel = 0.1 |
Relative band on |coarse − dense| / dense. Smoke measured worst: 0.023 (4× safety → 0.10). |
| CI coverage | boolean | [floor(ci_lo), ceil(ci_hi)] must contain the dense truth. |
Case: cross_ols
cluster_atom: dense=1 coarse=1
| Target | Partial | Dense_status | Dense_N | Coarse_status | Coarse_N | Rel_diff | Acc_PASS | CI | Cov_PASS |
|---|---|---|---|---|---|---|---|---|---|
| x1 | FALSE | fitted | 55 | fitted | 58 | 0.0545 | TRUE | [54, 61] | TRUE |
| x2 | FALSE | fitted | 132 | fitted | 134 | 0.0152 | TRUE | [127, 140] | TRUE |
Crossing gates — cross_ols
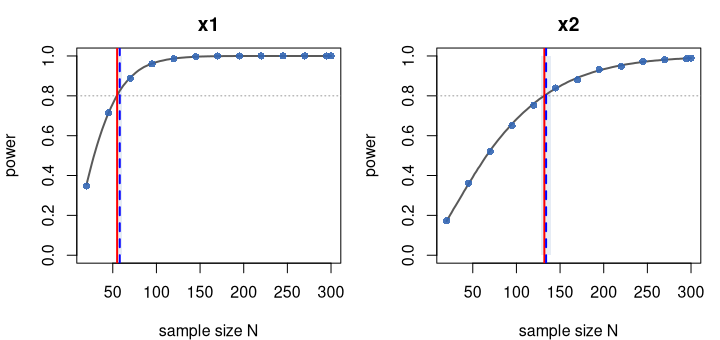
Grey curve = dense 100,000-sim ground truth; blue dots = coarse 1,600-sim default grid; dotted line = 0.8 target power. Red line = dense crossing (truth), blue dashed = coarse model-based crossing, shaded band = its 95% CI.
Dense run: sample_sizes 20 - 300, 141 points, 100000 sims Coarse run: sample_sizes 20 - 300, 13 points, 1600 sims
Golden frozen: data/cross_ols.golden.rds
Case: cross_glm
cluster_atom: dense=1 coarse=1
| Target | Partial | Dense_status | Dense_N | Coarse_status | Coarse_N | Rel_diff | Acc_PASS | CI | Cov_PASS |
|---|---|---|---|---|---|---|---|---|---|
| x1 | FALSE | fitted | 38 | fitted | 40 | 0.0526 | TRUE | [38, 42] | TRUE |
| x2 | FALSE | fitted | 70 | fitted | 73 | 0.0429 | TRUE | [68, 77] | TRUE |
Crossing gates — cross_glm
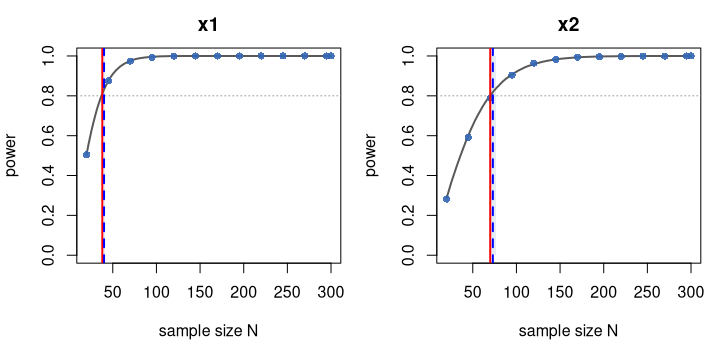
Grey curve = dense 100,000-sim ground truth; blue dots = coarse 1,600-sim default grid; dotted line = 0.8 target power. Red line = dense crossing (truth), blue dashed = coarse model-based crossing, shaded band = its 95% CI.
Dense run: sample_sizes 20 - 300, 141 points, 100000 sims Coarse run: sample_sizes 20 - 300, 13 points, 1600 sims
Golden frozen: data/cross_glm.golden.rds
Case: cross_lme
cluster_atom: dense=10 coarse=10
| Target | Partial | Dense_status | Dense_N | Coarse_status | Coarse_N | Rel_diff | Acc_PASS | CI | Cov_PASS |
|---|---|---|---|---|---|---|---|---|---|
| x1 | FALSE | fitted | 60 | fitted | 60 | 0 | TRUE | [52, 60] | TRUE |
Crossing gates — cross_lme
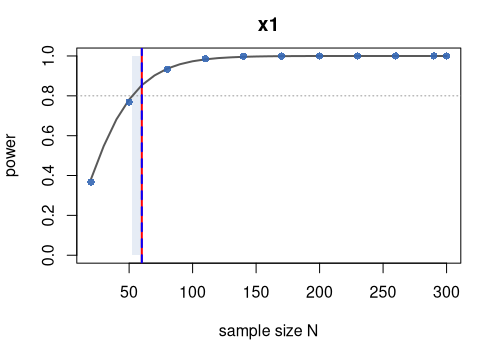
Grey curve = dense 100,000-sim ground truth; blue dots = coarse 1,600-sim default grid; dotted line = 0.8 target power. Red line = dense crossing (truth), blue dashed = coarse model-based crossing, shaded band = its 95% CI.
Dense run: sample_sizes 20 - 300, 29 points, 100000 sims Coarse run: sample_sizes 20 - 300, 11 points, 1600 sims
Golden frozen: data/cross_lme.golden.rds
Case: cross_partial
cluster_atom: dense=1 coarse=1
| Target | Partial | Dense_status | Dense_N | Coarse_status | Coarse_N | Rel_diff | Acc_PASS | CI | Cov_PASS |
|---|---|---|---|---|---|---|---|---|---|
| x1 | FALSE | fitted | 55 | fitted | 58 | 0.0545 | TRUE | [54, 61] | TRUE |
| x2 | TRUE | not_reached | NA | not_reached | NA | NA | NA | [NA, NA] | NA |
Crossing gates — cross_partial
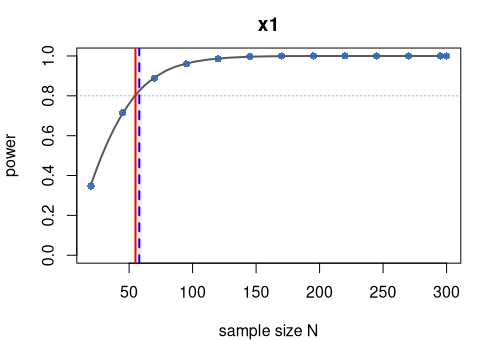
Grey curve = dense 100,000-sim ground truth; blue dots = coarse 1,600-sim default grid; dotted line = 0.8 target power. Red line = dense crossing (truth), blue dashed = coarse model-based crossing, shaded band = its 95% CI.
Dense run: sample_sizes 20 - 300, 141 points, 100000 sims Coarse run: sample_sizes 20 - 300, 13 points, 1600 sims
cross_partial: partial target (x2) is not-fitted as expected (status=not_reached).
Golden frozen: data/cross_partial.golden.rds
All gates PASS.
Summary
| Case | Target | Partial | Dense_N | Coarse_N | Rel_diff | Acc_PASS | Cov_PASS |
|---|---|---|---|---|---|---|---|
| cross_ols | x1 | FALSE | 55 | 58 | 0.0545 | TRUE | TRUE |
| cross_ols | x2 | FALSE | 132 | 134 | 0.0152 | TRUE | TRUE |
| cross_glm | x1 | FALSE | 38 | 40 | 0.0526 | TRUE | TRUE |
| cross_glm | x2 | FALSE | 70 | 73 | 0.0429 | TRUE | TRUE |
| cross_lme | x1 | FALSE | 60 | 60 | 0.0000 | TRUE | TRUE |
| cross_partial | x1 | FALSE | 55 | 58 | 0.0545 | TRUE | TRUE |
| cross_partial | x2 | TRUE | NA | NA | NA | NA | NA |
All crossing gates across all cases