MCPower — Agreement With Other Power Tools
What this report shows
The other validation reports prove correctness the strict way: split the pipeline in two and check each half against a trusted reference (see the validation overview). This report is a softer, complementary check — not a gate. It asks a simpler question that a practitioner actually cares about:
If you computed power for the same design with a different, independent tool, would you get the same answer?
So MCPower's simulated power is laid side-by-side with two kinds of independent estimate across the whole benchmark suite:
- Dedicated R power tools —
simglmfor the OLS / logistic designs andsimrfor the mixed-effects (LME) designs, each driven through its own documented API. - A hand-written DIY loop (
loop_best) — a from-scratch simulate → fit → count loop that reuses none of MCPower's engine. It is the cleanest independent reimplementation of the same idea, and it covers every case, including the ones (correlated predictors, the GLMM family) that no off-the-shelf tool offers.
Why this is informal, not a gate
This is a corroboration check, not a proof, for two honest reasons:
- The references are noisy. MCPower runs each point at 10,000 simulations; the dedicated tools run far fewer (simglm ~100, simr ~30) and the DIY loop a few hundred. At those counts the reference itself carries Monte-Carlo error of several percentage points, so the bar is agreement within that band, not an exact match. The shaded ±0.05 band on the plots below marks roughly that tolerance.
- The tools parameterise designs differently. Effect-size and random-effect conventions don't line up one-to-one between packages, so small systematic offsets are expected and uninteresting. What matters is that the curves track each other and the scatter hugs the diagonal.
The strict, low-tolerance evidence lives in the per-solver and data-generation reports; this page is the "and it also matches what everyone else gets" sanity layer on top.
Power vs sample size
For each design, power is traced as the sample size grows. MCPower (orange) is the dense 10,000-sim reference; the dedicated tool (blue/green squares) appears where one exists; the DIY loop (purple) appears on every panel.
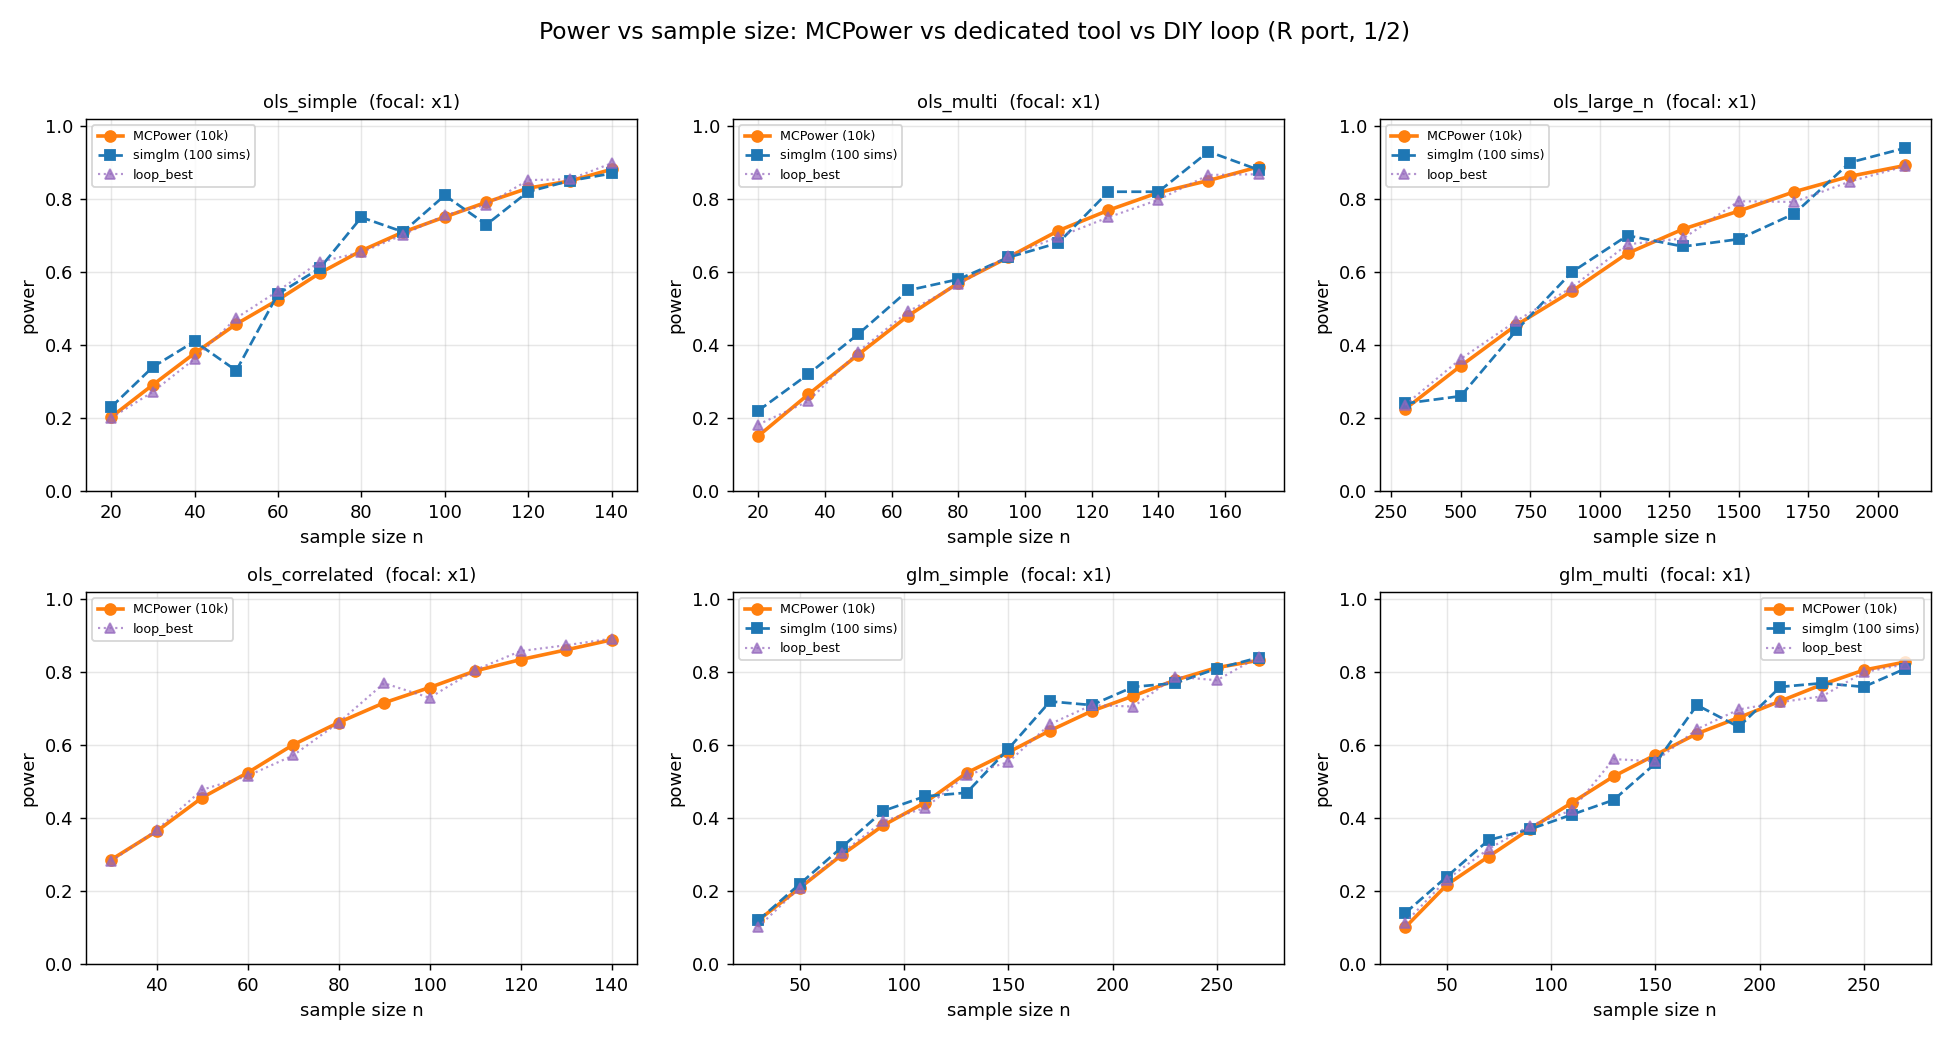
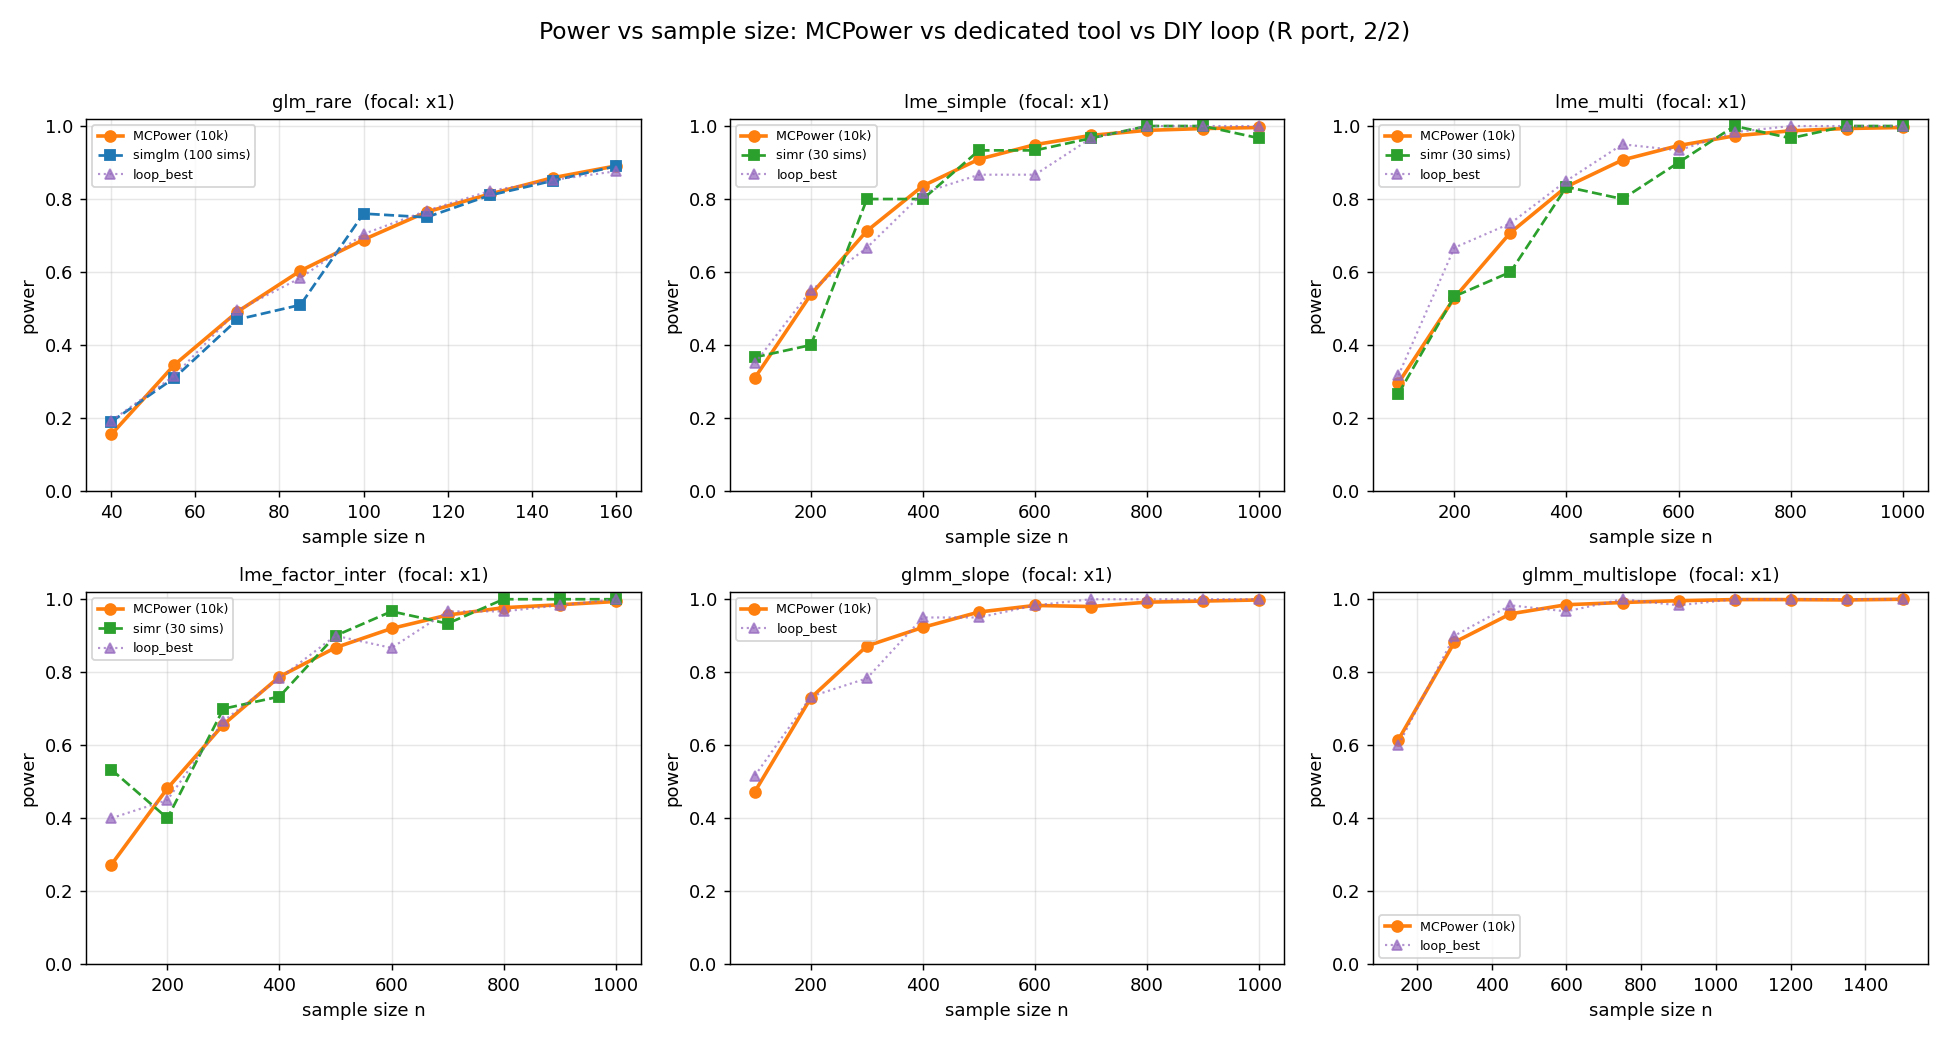
All three estimates rise together along each curve. The dedicated-tool and
DIY-loop markers jitter around the smooth MCPower line by a few points — exactly
the Monte-Carlo wobble expected at their lower simulation counts — but none drifts
systematically off it. The four designs with no square marker (ols_correlated
and the three glmm_*) have no dedicated tool to compare against; the DIY loop is
their independent witness.
Head-to-head agreement
Collapsing every (design, sample-size, focal effect) point onto a single scatter: the closer to the dashed diagonal, the better the agreement.
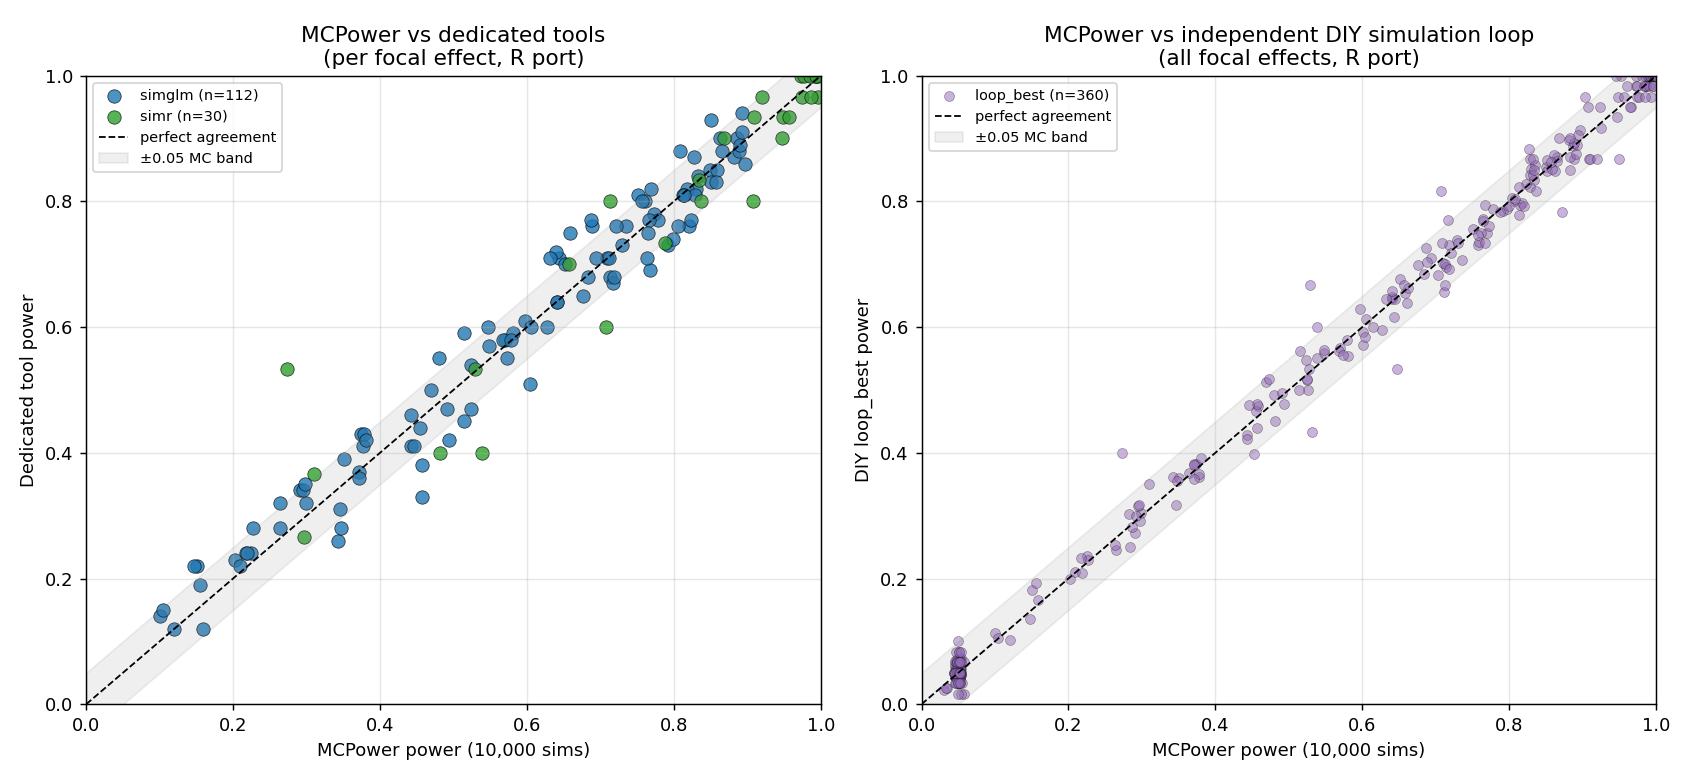
Left — versus the dedicated tools. Right — versus the independent DIY loop. Both
clouds sit on the diagonal, mostly inside the ±0.05 Monte-Carlo band. The handful
of wider misses are all low-simulation-count simr points (30 sims), where the
reference, not MCPower, is the noisy one.
| Comparison | Points | Mean |Δ| | Median |Δ| | Max |Δ| |
|---|---|---|---|---|
vs simglm (OLS / GLM, ~100 sims) |
112 | 0.035 | 0.033 | 0.128 |
vs simr (LME, ~30 sims) |
30 | 0.045 | 0.028 | 0.261 |
vs DIY loop (loop_best, all designs) |
360 | 0.015 | 0.010 | 0.137 |
The mean absolute gap to every reference sits at or below the Monte-Carlo noise of that reference, and it is tightest against the DIY loop — the comparator that shares MCPower's exact simulate-and-count definition of power while sharing none of its code.
See also the strict, per-solver evidence in OLS solving, GLM solving, and MLE solving, or the validation overview for how the whole pipeline is proved.